Summary
During this third lesson in the Connecting Social Issues and Health Inequities unit, students will analyze satellite images of two locations, calculate the percentage of squares that are mostly forested and those that are mostly urbanized (using aerial images of two different zip codes with drastically different health issues), and write a CER that connects any differences between the two locations that would influence human health. At the conclusion of the lesson, students will write a proposal that they can present to community members, city council members, family, and peers that consider community-level changes, aim to improve air quality, and raise awareness of environmental racism.
Essential Question(s)
How do inequitable environmental factors affect human health?
Snapshot
Engage
Students analyze satellite images of two locations.
Explore
Using aerial images of two different zip codes with drastically different health issues, students calculate the percentage of squares that are mostly forested and mostly urbanized.
Explain
Students discuss their observations from previous activities as a whole group.
Extend
Students write a CER that connects the differences between the two locations that would influence human health.
Evaluate
Students create a proposal that they can present to community members, city council members, family, and peers that consider community-level changes, aim to improve air quality, and raise awareness of environmental racism.
Materials
Lesson Slides (attached)
CER- The Role of Green Spaces (attached; one per student)
Zip Code Breakdown- The Role of Green Spaces (attached; one per student)
Driving Question Board - (attached; one per student)
Proposal Rubric- The Role of Green Spaces (attached; one per group)
Proposal Project Instructions- The Role of Green Spaces (attached; one per group)
Page protectors or dry erase pockets (optional; one per student)
Dry erase markers (optional; one per student)
Sticky notes
Pens/pencils
Engage
Begin the lesson by projecting the unit’s essential question on slide 3 of the attached Lesson Slides.
Display slide 4. Share the lesson’s learning objectives.
Display slide 5. Share the modified instructional strategy, Photo or Picture Deconstruction, with students. You do not need to cut the images for students to analyze the aerial photos.
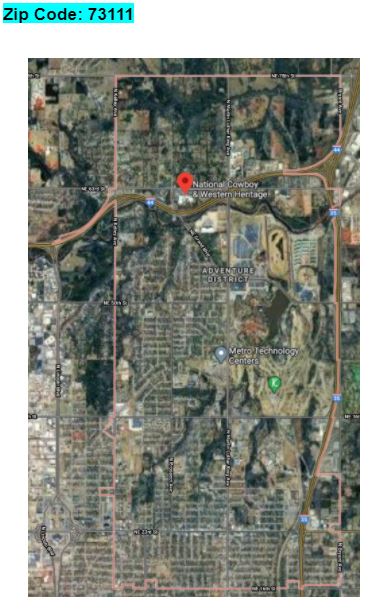
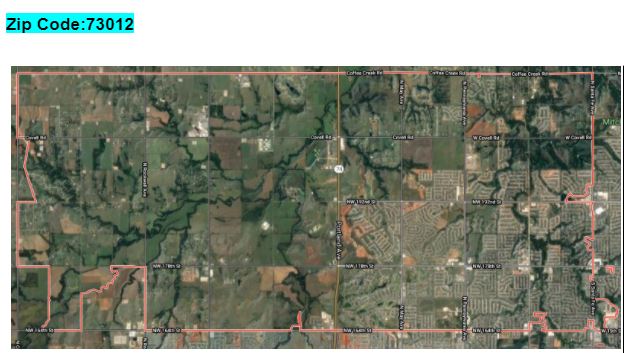
Rather than having students work on just one photo, instruct them to compare the two photos on slide 6. Inform them that the residents who reside in zip code 73012 are generally healthier than residents who reside in zip code 73111. Have students identify some environmental factors that might contribute to this difference. Remind students to record and describe exactly what they see (people, places, objects) without interpretation.
Ask students to hypothesize what they might not know about the map photographs and how they might find the information. Students should focus their attention on the area inside the faint red line.


Explore
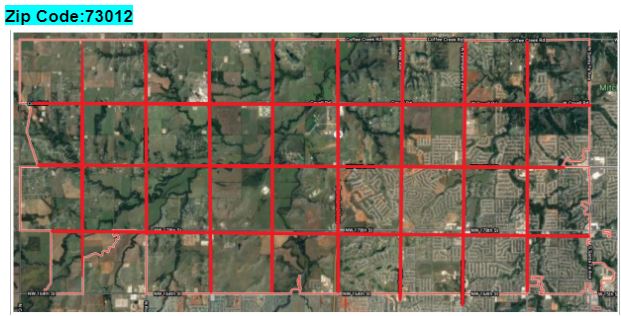
Display slide 7. Pass out the attached Zip Code Breakdown handout, a transparency or page protector, and a dry erase marker. Instruct students to continue to compare the same aerial photos by placing the transparency over each photo. Have students use a dry erase marker to create a grid over the top of the photo. Recommend students use the mile markers on the roads. Use the image below as an example. For reference, this is the first photo used in the Engage section.

Next, instruct students to calculate the percentage of squares that are mostly forested and those that are mostly urbanized.
Display slide 8. Instruct students to have a discussion in their small groups about the following questions:
What similarities did you notice between the two aerial map images?
What differences did you notice between the two aerial map images?
What does this mean?
What evidence do you have to support your claim?
Explain
Display slide 9. As a whole group, facilitate a discussion to allow students to share what differences they noticed in the two areas. During this discussion, ask students what they remember about photosynthesis that might have an effect on air quality.
Display slide 10. This is a good time to refer back to the Driving Question Board handout. Ask students if they have answered any questions that were originally added to the board. Additionally, ask if there are new questions that should be added to the Driving Question Board.
Extend
Display slide 11. Share the instructional strategy, Claim, Evidence, Reasoning (CER), with students. Pass out the attached CER handout and instruct students to independently write a claim related to the differences between the two locations that would influence human health. Encourage them to use information from the previous lessons as their evidence or reasoning.
Evaluate
Display slide 12. Share the beginning of the final product proposals for the storyline with the students. Instruct students to create a proposal that they can present to community members, city council members, family, and peers that consider community-level changes, will improve air quality, and raise awareness of environmental racism.
Remind students to think about what they have learned in the previous lessons and begin by addressing the problem, providing evidence for what they are claiming, and providing a possible solution.
Divide students into small groups. Pass out the attached Community Proposal Project handout and instruct them to begin their proposals by discussing the following prompts:
What is the problem?
What do you know about the problem that other people should know?
What evidence can you provide to support what you are claiming?
What are some possible solutions to this problem?
Resources
EpicTop10.com. (2019, July 3). Photosynthesis. [Image]. https://www.flickr.com/photos/182229932@N07/48187656411
Google maps satellite. (n.d.). Oklahoma City, OK. [Aerial map photographs]. https://earth.google.com/web/@35.48264792,-97.4791978,363.52415431a,121151.59788577d,35y,0h,0t,0r
K20 Center. (2020). Claim, Evidence, Reasoning (CER). Strategies. https://learn.k20center.ou.edu/strategy/156
K20 Center. (2021). Driving Question Board. Strategies. https://learn.k20center.ou.edu/strategy/1511
K20 Center. (2020). Photo or Picture Deconstruction. Strategies. https://learn.k20center.ou.edu/strategy/140


